David Burdick P.E.
4917 SE Aldercrest Rd., Portland, Oregon 97222 USA
Abstract
Section III of the Plan of Implementation from the Johannesburg’s World Summit on Sustainable Development 2002 calls for the development of a 10-year plan to accelerate the shift towards sustainable consumption and production. A necessary component of this is to insure that, at a minimum, the sum impacts from all human actions fall within earth’s carrying capacity to mine, manufacture, power, transport and sequester these activities. Although methodologies exist to determine a sustainable and equitable maximum amount of earth’s resources per individual (the ecological footprint concept), devising a means to assign these parameters to the goods and services themselves has, until now, not yet been developed.
This paper offers a preliminary method to meet this challenge through a 3-step process.
Step 1 equitably allocates to an individual product its share of biophysical resources (land, air, water, ocean) relative to the product’s ratio of financial revenues to world revenues. Step 2 determines a specific product’s actual consumption of resources through a Life Cycle Analysis, with results expressed in biophysical units of land, air, water and ocean. Step 3 compares the allocated amount of land, air, water and ocean to the product’s actual consumption of these biophysical resources to establish the ecological sustainability goal for that product and determine its present level of sustainability.
The research intends to develop the methodology and databases and determine if this approach is effective in:
- Appealing to institutional purchasers in decisions to purchase environmentally preferable products and services.
- Persuasive with employees and purchasers on the merits of measuring a product’s environmental performance in terms of its level of sustainability.
- Prioritizing corporate investments in attaining higher levels of sustainability.
- Gaining organizational recognition and credibility from its stakeholders.
- Leveraging corporate ecological actions along the whole supply chain.
- Decreasing the overall life cycle costs of a product.
The research will be based in Portland, Oregon. Academic oversight of the research is through the Ph.D. program of Holland’s Erasmus University.
The overall goal of this research is to contribute interdisciplinary solutions to local, regional, and global problems. Organizations of all types (businesses, NGOs, governments and universities) play important roles in creating products, incentives and market forces to motivate sustainable development. All would profit from this encompassing understanding of sustainability that bridges the knowledge between economics and ecology and carries forward a tangible and rigorous methodology to measure a product’s level of sustainability relative to earth’s carrying capacity.
Keywords: sustainable, footprint, certification, production, market, reporting, sustainability, eco-label
SECTION 1: INTRODUCTION
Sustainable development is popularly defined as “development that meets the needs of the present without compromising the ability of future generations to meet their own needs.” (Brundtland, 1986)
Industry, in its attempts to meet corporate responsibilities, is left to use these abstract definitions in their actions towards sustainability. These definitions threaten the development of a definition of sustainability which ultimately must address the fundamental characteristics of living within earth’s carrying capacity (World Business Council on Sustainable Development). So far sustainable development has been mostly ineffective in motivating overall ecological improvement of the planet, as seen in the continued degradation of earth’s ecology (Worldwatch Institute 2001, UN Millennium Project). Equally dismal is the timid adoption rate of programs by industry that effectively address sustainable production. (Berkhout, 2001)
Studies suggest that, globally, humankind is not currently living sustainably (Hawken, et. al, 2000, Chambers et al 2001). Wackernagel and Rees, (1996) estimates that the global Ecological Footprint, on a per capita basis, requires 34% more bio-productive resources than is available on Earth. Bio-productivity itself is the subject of varying estimates (e.g. the ongoing research sponsored by the Food and Agriculture Organization of the United Nations (FAO) and the International Institute for Applied Systems Analysis (IIASA) entitled the Global Agro Ecological Zones (GAEZ), 2000) but there is some consensus on the finite nature of the limiting factors-terrestrial air, ocean, air, fresh water. This bio-productivity is required to grow and sequester the products and services presently consumed (WWF Living Planet Report, 2002). The overburdening of the bio-capacity results in a draw down of natural resources. The catalogue of global crises; including global warming, increased global toxification, loss of fisheries, increased rates of extinction and reduction in water quality and quantity, tropical deforestation, soil erosion, and acidification supports the position that we are failing to live within the planet’s sustainable capacity.
In order to address sustainable development within the carrying capacity of ecosystems, a definition that accounts for the finite biophysical services of earth is needed. In 1991, the World Conservation Union, United Nations Environmental Programme, and The World Wide Fund for Nature (WWF) did just this with their definition that defines sustainable development as development which “improves of the quality of human life while living within the carrying capacity of supporting ecosystems”. But specifying earth’s carrying capacity is extremely complex (Daily and Ehrlich, 1992; Cohen, 1996). Wackernagel and Rees, (1996) approached this by hypothesizing that, as a minimum requirement for sustainability; humanity must live within its finite resource of its productive area-a biophysical limit. Their approach quantifies society’s activities in terms of the land area that would be required to sustainably produce and power the goods and services the population demands and to sequester their energy and product emissions, calling the results the Ecological Footprint. Comparing the per capita consumption (the demand) to the available per capita area (the supply) gives a measure of sustainability. By dividing the global population by the available supply, it is possible to postulate the sustainable average ‘Earth Share’ of biophysical resource per person. Such benchmarking enables a region, be it a community, country or the whole planet to measure and monitor their progress on the road to sustainability.
Recent years have seen an increase in companies using Environmental Management Systems but few of these take a life cycle approach and account for flow of materials and energy (C. Eccleston; 2002; M. Mohammed, 2000; D. Burdick, 1999). Most focus on emissions and pollution and, whilst this is necessary for compliance with regulations, the potential financial and environmental benefits of reduced resource use (or eco-efficiency) cannot easily be adduced from this approach.
A number of approaches are available to businesses wishing to assess the environmental impact of their products or services. Methods reviewed include Life Cycle Analysis (LCA) (C. Eccleston; 2002; M. Mohammed, 2000), Energy and Material Flow Analyses (EMFA) (F. Vancini, 2001; J. Korhonen, 2001), or Mass Balance Analysis (MBA) (K. Breivik, 2002) and Material Intensity per Unit Service (MIPS) (F. Hinterberger, 1999; K. Vringer and K. Blok, 2000). Ecological Footprint Analysis (EFA) is a system of accounting and expressing environmental impact that draws on all these approaches (H. Pulm, 2001; J. Holmberg, 1999).
The Footprint indicator is shown to have several advantages; the single index provides for ease of communication and understanding, a variety of goods, activities and services can readily be assessed and compared, a link can easily be made between local and global consumption, and an assessment of sustainability is possible.
Ecological Footprint Analysis uniquely approaches the issue of sustainability by reference to the overall “carrying capacity” of the planet. It is possible to link individual behavior to regional and global targets.
For example, comparing a consumer’s ecological footprint to their equitable allocation can be expressed in the following formula:
S= A/R
S = Sustainability level
A = A consumer’s Allocated share of global biophysical resources.
R = A consumer’s Required share of global biophysical resources
If S > 1, the consumer meets conditions which are biophysically restorative.
If S = 1, the ” ” ” ” ” ” sustainable.
If S < 1, the ” ” ” ” ” ” unsustainable.
Presently, the equitable allocation of land is 1.8 hectares/consumer, a number derived from the amount of bio-productive land divided by global population. Average consumption per consumer varies from country to country, a function of population, affluence, and technology. An average Asian, for example, uses roughly 1.3 hectares to produce and sequesters the resources he/she consumes, resulting in a level of sustainability of 1.8/1.3 or 139%. An average European uses 4.9 hectares, resulting in a level of sustainability of 1.8/4.9 or 33%. An average American uses 9.5 hectares, which gives a level of sustainability of 19%.
In the same manner, expressing a product’s level of sustainability requires allocating an equitable share of earth’s resources to the product that meets human goods and services and then comparing that to the actual amount used.
The following paper offers a preliminary methodology to address sustainability from a product perspective.
SECTION 2: DETERMINING A PRODUCT’S LEVEL OF SUSTAINABILITY
The specific research involves developing a discreet, defensible, simple and transparent methodology which:
- Determines a product’s Allocated share of global biophysical resources (A) in terms of land, air, water and solar energy.
- Determines the supporting biophysical resources; land, air, water and ocean Required (R) by the product to create, manufacture, use, transport and dispose,
- This produces, by simple division of 1 and 2 above, a dimensionless indicator that measures a product’s level of sustainability (S) relative to a global standard.
Mathematically, The Sustainability Formula Would Be Expressed As:
S= A/R
S = Sustainability level
A = A product line’s Allocated share of global biophysical resources.
R = A product line’s Required share of global biophysical resources.
If S > 1, the product meets conditions which are biophysically restorative.
If S = 1, the ” ” ” ” ” ” sustainable.
If S < 1, the ” ” ” ” ” ” unsustainable.
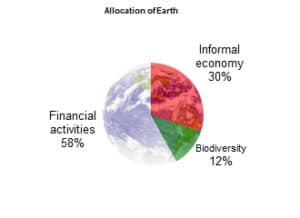
The first step in this process is to estimate how much earth is available to a company’s product line. One such tentative approach would be to explore the consideration that not all human activities produce revenues; therefore, it follows that not all of earth can be allocated for revenue production. Activities such as rural agriculture, childcare, and recreation are done for non-financial reasons; yet require a portion of earth to accomplish. To reflect this concept, a share of earth’s biophysical resources is reserved for this ‘informal economy”. Based on the work of Hazel Henderson and her estimate of the informal economy (Henderson, 2002), a figure of 30% is used. Thus total available land, air, water and sea attributable to businesses are reduced by 30%. (See figure 1)
Following the methodology developed by Chamber, Simmons and Wackernagel (2001), an additional percentage of land, air, water and ocean could be reserved for the exclusive use of biodiversity that is intolerant of mankind’s development. Estimates vary for the amount of land etc. which need to be reserved, and range anywhere between 25 and 75% for land alone. (Reed Noss, 1991a 1991b, Noss and Cooperrider 1994, Eugene Odum 1970) Currently, 3% of the earth’s land is protected (Chambers, et al, 2001). Although it may not be adequate, for purposes of demonstrating the model, a figure of 12% of the earth is arbitrarily reserved for biodiversity. See Figure 1.
 |
 |
| Figure 1 Estimated allocation of formal, informal and attributable to businesses | Figure 2 Total biophysical biodiversity shares resources of earth |
The second tentative step in this process is to develop a fair means to divvy up product’s share of the earth’s biophysical resources relative to the number of customers each product serves.
It is intended to accomplish this through using the proxy ratio of company’s product revenues to world revenues, which can then be expressed in biophysical resource allocated to the company per Euro (€) revenue compared to the gross global business allocation.
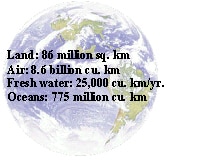
For example, World revenues are approximately € 62 trillion (World Bank, 2006). Dividing the biophysical resources (World Resource Institute, 1997-2001) by world revenues gives the following area/revenue ratios.
Biophysical Unit |
Biophysical resource allocated per given unit of revenue |
| Land = 86 x 106 sq km / € 62 x1012 /yr | = 1.42 sq km-yr/€m revenue |
| Air = 8.6 x 10⁹ cu km / € 62 x1012 /yr | = 141 cu km-yr/€m revenue |
| Water = 25,000 x 1012 liters € 62 x1012 /yr | = 410 liters-yr/€ revenue |
| Ocean = 775 x 106 cu km / € 62 x1012 /yr | = 12.6 cu km-yr/€m revenue |
Table 1 Allocation table of biophysical resource per given unit of revenue
The results of a total LCA for a business’s product or service is then normalized to the biophysical resources outlined above.
Once the total amount of land, air, water and ocean is calculated for the full life cycle of businesses’ products and services (extraction, transport, manufacturing, use and disposal), the last step would be to compare the amount of land, air, water and ocean allocated to it.
In theory, given two product of equal revenues, a product that meets humanities needs and services (and is financially remunerated) through low impact processes as organic agriculture or utilizes design and production techniques which results in a recyclable, non toxic, low energy product would have a relatively high S, while a product that is highly toxic, non recyclable, and requires relatively higher energy inputs would have a relatively low S.
Note* In situations where the company is in the supply chain, rather than selling directly to the consumer, then a modification of the above can be used. Rather than basing allocations on total revenues, and impacts on the lifecycle of the product, allocation of biophysical quantities would be made based on the value added to the product (Revenues minus cost), and actual footprint would be based on the impacts accruing from the processes which give the value added. In this case, the methodology is used to compare the relative level of sustainability between corporations and their products within a specific industry sector.
The following example illustrates one practical application of this methodology.
SECTION 3: AN EXAMPLE
ACME Semiconductor Company manufactures specialty silicon chips for data storage has total Purchasing Power Parity [1] revenues for their product line is 3.75 billion Euros. A full life cycle assessment of its products was conducted and translated to land, air water and sea areas. Only the land assessment is detailed in this example and is given on figures 3 and 4.
The product made at ACME Company; € 3.75 billion in total Purchasing Power Parity revenues, contributes 0.00605% of gross world revenues and is thus allocated:
- 5,330 sq. km land
- 534,000 cu km air
- 1,575 billion liters fresh water
- 48,100 cu. km. sea
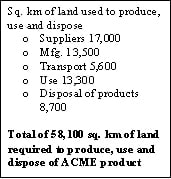
From the land perspective, ACME’s product’s level of sustainability is 5,330 sq. km/ 58,100 sq. km or just over 9% of meeting conditions to achieve sustainability.
ACME has thus far determined their product’s level of sustainability and production and helped develop a sense of its goal or ‘distance to target’. They have also been able to discern where to prioritize their efforts to attain sustainability. Suppliers, which require 17,000 of its total 58,100 sq. km, have the largest requirement for land (see figures 3 and 4).
 |
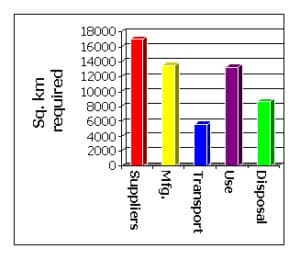 |
| Figure 3 Total land required | Figure 4 Breakdown of Product Life cycle in terms of land |
Suppliers are thus targeted first for analysis. These break down into four main categories of supplies: silicon, chemicals, metals and plastics. (See figure 5)
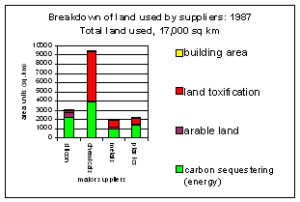
Figure 5 Breakdown of supplier and their land requirements prior to efforts to reduce impacts
Further analysis shows that the major contributors to land requirements from the suppliers are due to land toxification from the chemicals and in carbon sequestering from all suppliers (figure 5).
Over the years, ACME’s product switched to non-toxic chemicals and purchased energy generated from renewable energy sources (solar/wind/geothermal). This brought its product’s total land requirement to 3,600 sq. km, as seen in Figure 6.
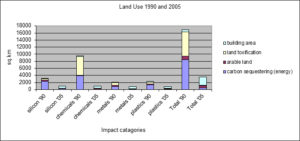
Figure 6 Breakdown of supplier and their land requirements before and after efforts to reduce impacts
Similar analysis was made in the other phases of the product’s lifecycle and land requirements were subsequently reduced:
- Manufacturing: From 13,500 sq. km to 730 sq. km due to radical reduction in virgin materials, toxic chemicals and fossil fuel.
- Transport: From 5,600 sq. km to 300 sq. km due to the use of rail transport, community sized production, and bio- and hydrogen fuels used which were generated by solar power.
- Use: From 13,300 sq. km to 200 sq. km due to using electricity which was generated from solar/wind renewable sources.
- Disposal: From 8,700 sq. km to 500 sq. km due to the new product take back program by ACME
The results reduce land use from 58,100 sq. km to 5,330 sq. km. (See figure 7) This equals the land allocated to the product and thus achieves the conditions for a 100% sustainable product (land component).
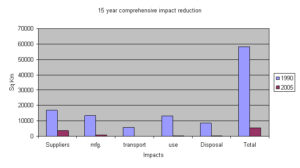
Figure 7 15 year comprehensive impact reduction (land component)
This process is then repeated for air, water and sea in order to calculate its complete indicator of sustainability. These indicators are calculated by using the product’s allocated amounts divided by the biophysical amounts actually used. The analysis yields the following:
- Air: 534/1,483 x 103 cu km = 36 % sustainable
- Fresh Water: 1575/2972 x 109 liters = 53 % sustainable
- Ocean: 48,100/5465 cu km = 88 % sustainable
The overall, un-weighted average aggregate among the 4 biophysical units is 70%.
A certification seal is then applied to this example, resulting in the following Eco-label.
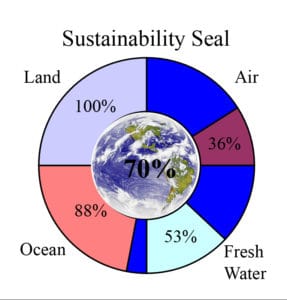
Figure 8 Eco-label Sustainability Seal
Products certified to the Sustainability Seal could qualify for inclusion into restorative business models (Daily & Ellison, 2002; Hawken & Lovins, 2000). This system rewards consumers or investors for enhancing natural and social capital. One type of restorative business model utilizes a values-based scheme. This system encourages loyalty to products and services that perform measurably better than market standards. This is a well-tested strategy of mainstream merchandising, exemplified by the rewards system used by the airline industry’s “frequent flyer miles”. Points are accrued by private or institutional consumers who purchase auditable and measurable, “Sustainability Seal” products and services. These points would then be redeemed later at the purchasers’ behest for additional, ecologically preferable, goods or services.
SECTION 4 BENEFITS AND OPPORTUNITIES
Organizations of all types (businesses, NGOs, governments and universities) play important roles in creating products, incentives and market forces to motivate sustainable development. All would profit from this encompassing understanding of sustainability that bridges the knowledge between economics and ecology and carries forward a tangible and rigorous methodology to measure sustainable enterprises relative to earth’s carrying capacity.
A methodology that measures a product’s level of sustainability benefits organizations in the following ways:
- It presents a market advantage to organizations offering products with a higher level of environmental performance (sustainability). Business opportunities can be realized by marketing this enhanced credibility to the growing group of environmentally conscious purchasers and investors through restorative business models.
- It gives a concrete, simple and easily understood measure of an organization’s sustainability goal and an internal understanding of the effort needed to meet this goal.
- It allows a company to prioritize its sustainability efforts on the specific product phases that consumes the largest amounts of biophysical resources.
- It gains organizational leadership and credibility from its stakeholders (investors, environmental groups, employees and public citizens). When used to publish its level of sustainability and efforts made toward attaining it, the company informs stakeholders of its situation relative to the big picture of global carrying capacity.
- It can be used as a compliment to CERES Global Reporting Initiative (GRI) by giving a contextual overview of the various efforts made to attain sustainability.
- It shares responsibility with the consumer for attaining sustainability by leveraging its corporate actions for their customers.
- It creates a synergy along the whole supply chain.
- It saves money, as higher levels of eco-efficiency realized through this methodology often translate into financial savings (less waste = lower costs).
Funding, development and testing acceptable metrics for measuring a product’s level of sustainability will come from establishing a balanced, multi-stakeholder coalition of progressive corporations, non-government organizations, academia and government entities. If you would like to participate in this progressive coalition, please contact the author David Burdick- email: dburdick@sustainablesteps.com.
Acknowledgments
Drs. Stuart Cowan, Bill Rees, Marsha Willard
References
Bruntland Commission (1986), “Our Common Future”, in The World Commission on Environment and Development, Oxford University Press, New York
Chambers, N., Simmons, C and Wackernagel, M. (2001) Sharing Nature’s Interest, Earthscan Publications Ltd, UK
Daily, G.C. and Ehrlich, P.R (1992), “Population, Sustainability and Earth’s Carrying Capacity: A framework for estimating population sizes and lifestyles that could be sustained without undermining future generations”, BioScience, November 1992
Daily, GC, Ellison, K (2002), “New Economy of Nature: The Quest to Make Conservation Profitable, The”, Island Press, April 2002
Hawken, P, Lovins A, Hunter, L. (2000) Natural Capitalism, Earthscan, UK
Norton B. (1992) “Sustainability, human welfare, and ecosystem health”, Environmental Values, vol. 1, no. 2, pp. 97-111
Noss, Reed F. (1991) “From endangered species to biodiversity” pp 227-246, in KA Kohm, (ed) 1991, Balancing on the Brink of Extinction: The Endangered Species Act and Lessons for the Future, Washington, DC: Island Press
Noss, Reed F, (1991) “Sustainability and wilderness”, Conservation Biology, pp 120-121
Noss, Reed F. and Cooperrider, Allen Y. (1994), Saving Nature’s Legacy-Protecting and Restoring Biodiversity, Washington DC: Island Press
Odum, Eugene P. (1970) “Optimum population and environment: A Georgia microcosm”, Current History, 58, pp 355-359
Wackernagel, M. and Rees, W.E. (1996) Our ecological footprint: reducing impact on the earth, New Society, Gabriola Island, BC, Canada
World Conservation Union (IUCN), United Nations Environment Programme (UNEP), and World-Wide Fund for Nature (WWF), (1991) Caring for the Earth: A Strategy for Sustainable Living, IUCN, UNEP and WWF, Gland, Switzerland:
Worldwatch Institute, (2001) “Vital Signs”, W.W. Norton & Company, NY, NY
[1] Purchasing Power Parity: A nation’s GDP at purchasing power parity (PPP) exchange rates is the sum value of all goods and services produced in the country valued at prices prevailing in a single currency. The exchange rate is calculated on equitable amounts of labor for a given set of goods. This is the measure most economists prefer when looking at per-capita welfare and when comparing living conditions or use of resources across countries.